Consumers are not the only ones who have made full use of the Federal Reserve`s 7-year zero interest rate policy. As you will see in this chapter, companies have borrowed money like there`s no tomorrow. Over the past ten years, companies have more than doubled their outstanding amount of bonds and loans.


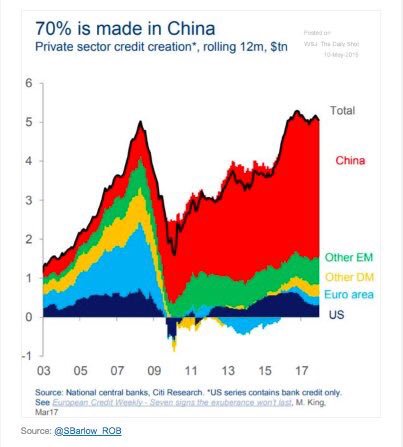
In the United States, corporate debt as a percentage of GDP has reached dangerous levels, surpassing the peak of the housing bubble. You can clearly see that the past three peaks have all taken place around the start of a recession. Currently, the graph is showing a slight downturn, which could indicate that corporate debt might slide back to 40% of GDP. I will not discuss China much in this newsletter, but as you can see in the previous chart, Chinese corporate debt has risen the fastest over the past 10 years, reaching a compound annual growth rate of almost 40%, compared to 7.8% in the U.S. , and 8.6% in Western Europe.


Worldwide M&A has increased by 65% compared to a year earlier. It has now reached USD 2.5 Trillion and shows no signs of slowing down. These are record levels, even surpassing the peaks of 2007. As you can also see from the chart below, M&A deals tend to peak right before the start of a recession.

All this cheap corporate credit has culminated in extremely high stock market valuations, and the use of the acronym TINA (There Is No Alternative): Bonds offer low yields, savings rates are down the gutter, so the only investment that still offers above average results is in stock markets.


“Be Fearful When Others Are Greedy and Greedy When Others Are Fearful”
- Warren Buffett -

You want to see more bottoms? The following chart is about U.S. worker productivity. It has been in decline for almost 1.5 decades and is most likely the cause of mediocre economic growth during most of that period. Despite all the technological advances, productivity doesn`t seem to be able to grow at the pace it used to. Has the internet revolution died down? Are we wasting too much time on social media, and the internet in general? Janet Yellen, the previous Chair of the Federal Reserve, stated that the outlook for productivity growth is a “key uncertainty for the U.S. economy”.

Bubbles are not only taking shape in listed companies. There are many examples where cheap credit has enabled businesses and their ideas to flourish in an environment where risk taking is encouraged, and where non-profitability is quickly being excused by using hype words like “Daily active users”, “Data rich” and “New paradigm”. Here are a few examples of non-listed businesses and activities that I think are in a bubble:


Do you remember CDO`s, Collateralized Debt Obligations? These instruments can be seen as the trigger to the 2008 crisis. Today there`s CLO`s, Collateralized Loan Obligations. The corporate borrowing that takes place at banks, immediately gets repackaged into a CLO security, which can be purchased by other investors. Insurance companies and pension funds are big buyers of these securities, because it offers higher yields than your average bonds. Why would a higher yield be offered? Because the quality of these loans inside the CLO is low, and thus the chance of default is high. As a reward for still taking the risk of purchasing these securities, higher yields are offered. Will the CLO story end in the same fashion as CDO`s did in 2008? Looking at the increases that are taking place in corporate borrowing, and the quality of these securities going down rapidly, I think I can confidently say that CLO`s will make the headlines in newspapers relatively soon.

“What is all this money spent on?”
In a normal economy, a company would borrow money to, for example, invest in Research and Development or to grow their business in a new market. The next few charts will show that most of this borrowed money has been spent on buying back shares (less shares on the stock market means that the company`s profit can be divided over a lower pool of shares, and thus creating the illusion of “higher earnings per share”), and on mergers and acquisitions (M&A). Of course I don`t have to tell you that all these share buybacks are taking place at a time when stock markets are at their peak. Recipe for disaster? You tell me.

In a normal economy, a company would borrow money to, for example, invest in Research and Development or to grow their business in a new market. The next few charts will show that most of this borrowed money has been spent on buying back shares (less shares on the stock market means that the company`s profit can be divided over a lower pool of shares, and thus creating the illusion of “higher earnings per share”), and on mergers and acquisitions (M&A). Of course I don`t have to tell you that all these share buybacks are taking place at a time when stock markets are at their peak. Recipe for disaster? You tell me.

Worldwide M&A has increased by 65% compared to a year earlier. It has now reached USD 2.5 Trillion and shows no signs of slowing down. These are record levels, even surpassing the peaks of 2007. As you can also see from the chart below, M&A deals tend to peak right before the start of a recession.

"Never let a good crisis go to waste"- Winston Churchill -
Of course, not all businesses are created equal, and a big discrepancy between industries has started to emerge. The tech industry has taken the lead when it comes to extreme valuations, and in particular the FAANG stocks: Facebook, Apple, Amazon, Netflix and Google. These stocks are showing valuations that resemble the dot-com mania. Compared to the S&P 500 index, FAANG stocks have outperformed tremendously over the past 12 months.

As the following table shows, FAANG plus Microsoft are responsible for 98% of the S&P 500`s entire Year-To-Date Returns! The Nasdaq would have even been negative Year-To-Date if it wasn`t for these companies.


This massive increase in stock market valuation has created a total market capitalization of U.S. domestic companies (that are listed on either the NYSE or NASDAQ) which has surpassed the valuation at the peak of the dot-com bubble. As a percentage of U.S. GDP, this equals 177%.
The S&P 500 is now in its longest consecutive positive streak ever if it manages to close the year positively.

“Aren`t there any stocks that are still priced at an attractive level?” But yes, that`s why I have called my newsletter bubbles and bottoms. There`s always an opportunity somewhere! Defensive stocks and financials are showing a clear bottom, as well as individual retailers like JC penny and Sears.

“Be Fearful When Others Are Greedy and Greedy When Others Are Fearful”
- Warren Buffett -

You want to see more bottoms? The following chart is about U.S. worker productivity. It has been in decline for almost 1.5 decades and is most likely the cause of mediocre economic growth during most of that period. Despite all the technological advances, productivity doesn`t seem to be able to grow at the pace it used to. Has the internet revolution died down? Are we wasting too much time on social media, and the internet in general? Janet Yellen, the previous Chair of the Federal Reserve, stated that the outlook for productivity growth is a “key uncertainty for the U.S. economy”.
Bubbles are not only taking shape in listed companies. There are many examples where cheap credit has enabled businesses and their ideas to flourish in an environment where risk taking is encouraged, and where non-profitability is quickly being excused by using hype words like “Daily active users”, “Data rich” and “New paradigm”. Here are a few examples of non-listed businesses and activities that I think are in a bubble:
- Co-working spaces like WeWork
- Bicycle sharing companies like oBike (sharing economy in general)
- E-commerce platforms like Lazada and Shopee
- Delivery services like Deliveroo, Honestbee and Foodpanda
- Taxi companies like Grab and Uber
Why do I think they are in a bubble? High valuations, Low margins, high burn rate and too much competition. The only way these companies seem to be able to create higher revenue than their competition is by offering discounts to the end user. The companies are expecting brand loyalty in return, but do not realize that they have turned their customers into discount-hungry users, who do not care about the platform as long as they can pay as little as possible for the product or service. This competition based on discounts creates a race to the bottom, with the winner being the one who can hold their non-profitable breath the longest.
Bloomberg has identified 69 big companies in the world that have boosted their debt levels by 50% or more in the past 5 years and now have at least USD 5 Billion in debt. Together they carry almost USD 1.2 Trillion in bonds and loans, with most of them having a “junk” status. The majority of these bonds and loans will have to be paid back in the next 7 years.
A few names: Softbank (Japan), China Evergrande Group (China), HNA Group (China), Greenland Holdings Corp (China), CenturyLink (U.S. ), Dell Technologies (U.S.).

Summary:
Companies around the world, especially in China and the U.S., are overvalued and too hungry for cheap credit. Corporate debt in and of itself is a great tool to grow your business, but over the past 10 years it has been made clear that most businesses have used this debt to buy back their own shares or participate in an M&A frenzy, instead of investing in manpower, Research and Development or other means of growing their revenue. This growth in debt has been made possible by, once again, the 7-year long zero interest rate policy by the Federal Reserve. In the next chapter, we`ll find out in detail how the U.S. government, together with Europe, China and Japan have contributed to these bubbles in corporate and consumer debt.

(Click to enlarge)
The information contained in this publication is not intended to constitute individual investment advice and is not designed to meet your personal financial situation. The opinions expressed in this publication is that of the publisher and is subject to change without notice. The information in this publication may become outdated and there is no obligation to update any such information.